Affiliate Disclosure: We may be compensated if you use our links to make a purchase. We are extremely selective in who we partner with & only recommend products we believe in. Our affiliate relationships do not influence our recommendations.
Any good LMS should provide instructors & admins with reporting data. This article will focus on LearnDash reporting tools. There are some default LearnDash reports that are included with the plugin, an official LearnDash reporting plugin called ProPanel, and several third-party LearnDash reporting tools that are arguably better than what LearnDash provides.
We’ll briefly cover each option in this article, but we’ll link out to more detailed reviews that provide additional information & screenshots.
Here’s a quick video explaining what this article will cover:
Subscribe to our YouTube channel for more LearnDash tutorials.
Table of Contents
- LearnDash CSV Reports (included w/ LearnDash)
- LearnDash Transactions (included w/ LearnDash)
- LearnDash ProPanel (premium, $49)
- Tin Canny Reporting (premium, $249)
- WISDM Reports for LearnDash (free & premium, $120)
- Easy Dash for LearnDash (free)
- Users Insights (premium, $99)
- LearnDash Gradebook (premium, $49)
- SCORM / xAPI
- Other LearnDash Reporting Plugins
1. LearnDash CSV Reports

The only default reporting that LearnDash provides is two .csv files that you can download.
- Course Data
- Quiz Data
Read More: Full review of LearnDash CSV Reports →
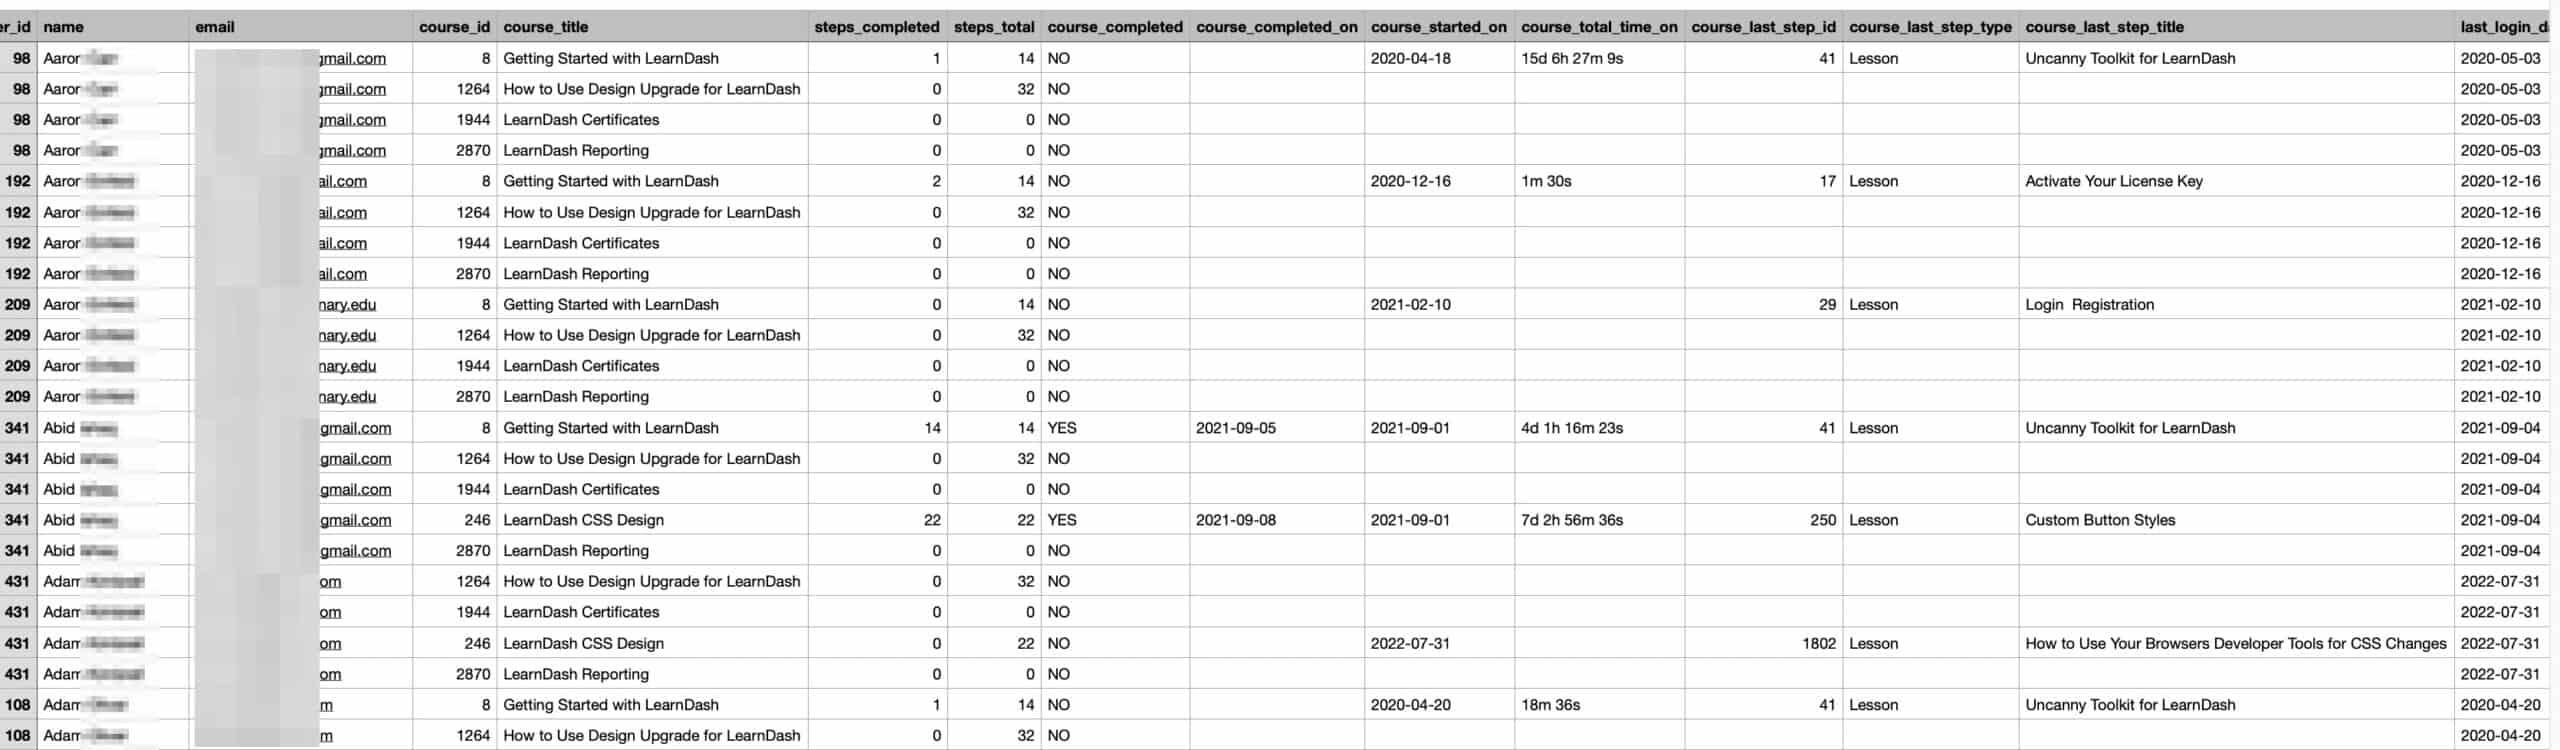
LearnDash Course Data Report
Each row of the .csv file contains the following information:
- User ID
- User Name (unfortunately, first & last name are combined in one field)
- User Email
- Course ID
- Course Title
- Steps Completed
- Total Steps in Course
- Course Completed (yes or no)
- Course Completed On (date only, no time)
- Course Started On (date only, no time)
- Total Time Spent on Course (in this format:
15d 6h 27m 9s) - Last Step ID (the post ID of the last lesson/topic/quiz the user completed)
- Last Step Type (could be lesson, topic, or quiz)
- Last Step Title
- Last Login Date (date only, no time)
Here’s an example:
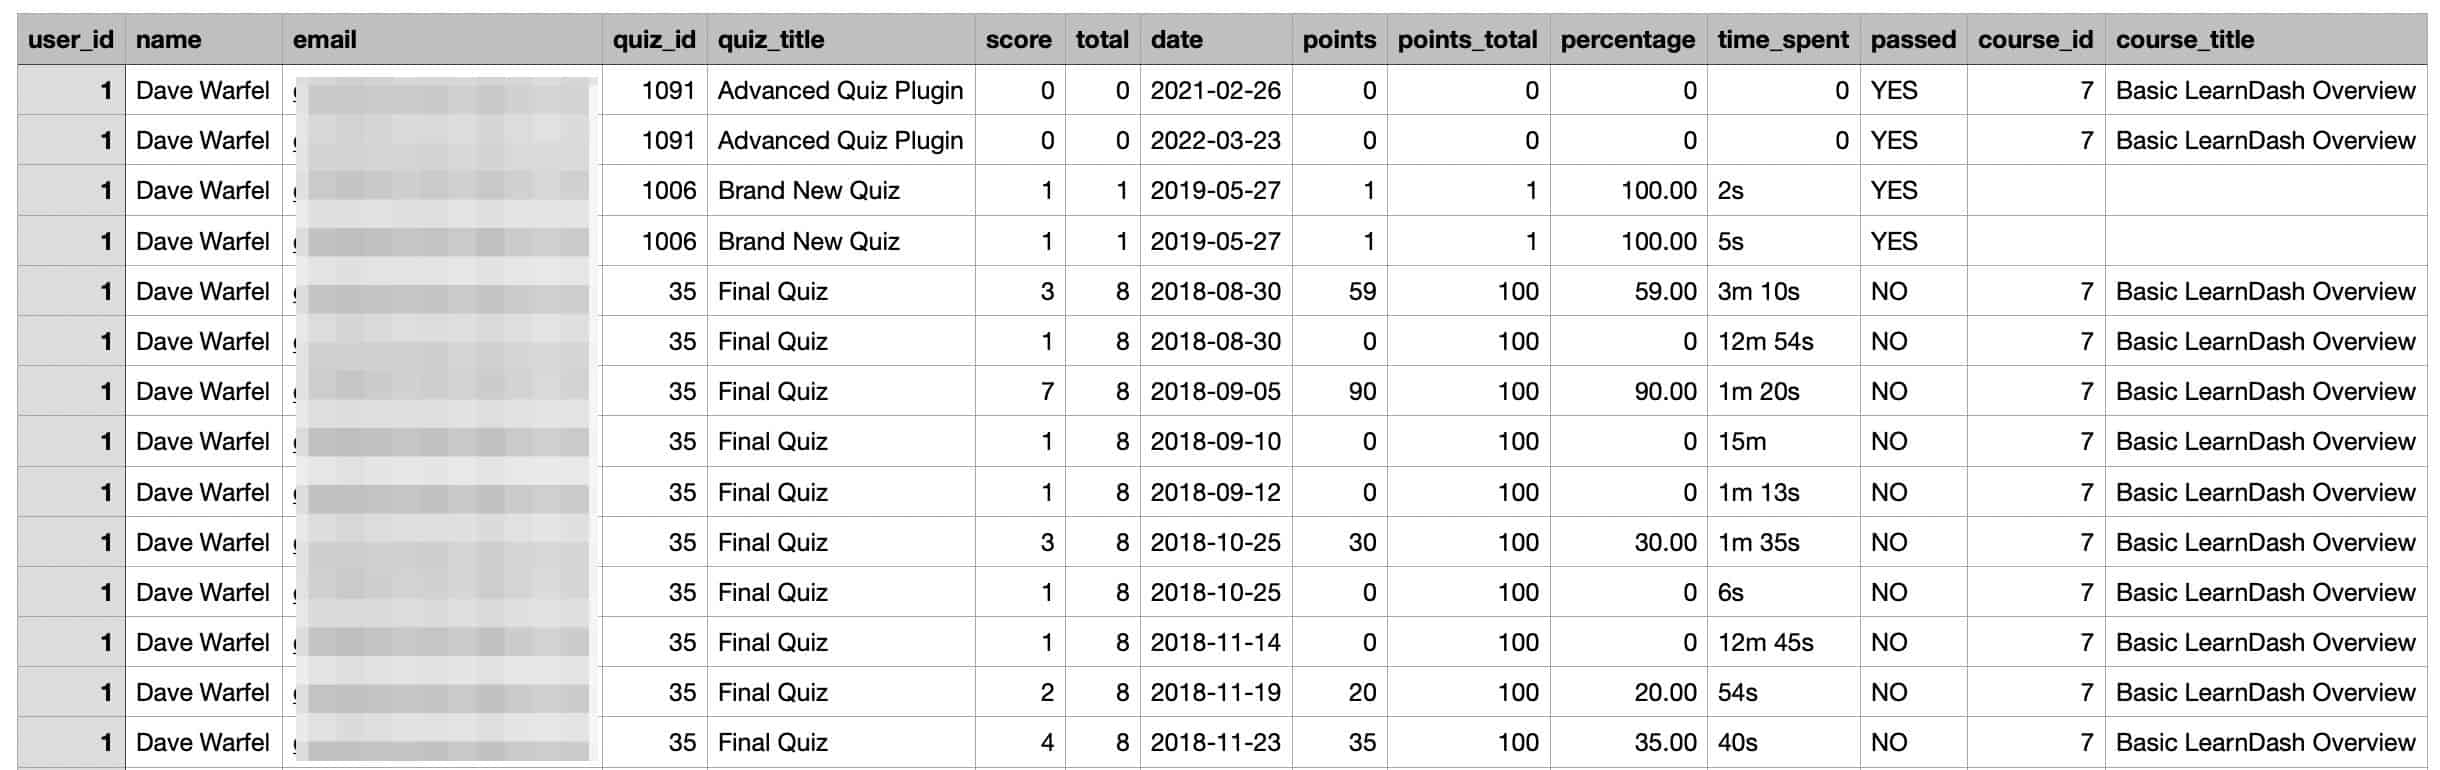
LearnDash Quiz Data Report
Each row of the .csv file contains the following information:
- User ID
- User Name (unfortunately, first & last name are combined in one field)
- User Email
- Quiz ID
- Quiz Title
- Score (correct questions)
- Total (total questions)
- Date (that the quiz was taken)
- Points (received)
- Points Total (total available)
- Percentage
- Time Spent (in this format:
12m 54s) - Passed (yes or no)
- Course ID (that the quiz was associated with)
- Course Title (that the quiz was associated with)
Here’s an example:
2. LearnDash Transactions
This data is only available if you’re using one of the built-in LearnDash payment methods—Stripe Connect, Stripe Add-on, PayPal, or Razorpay. All other third-party payment methods/plugins have separate reporting, and those transactions will not be displayed here.
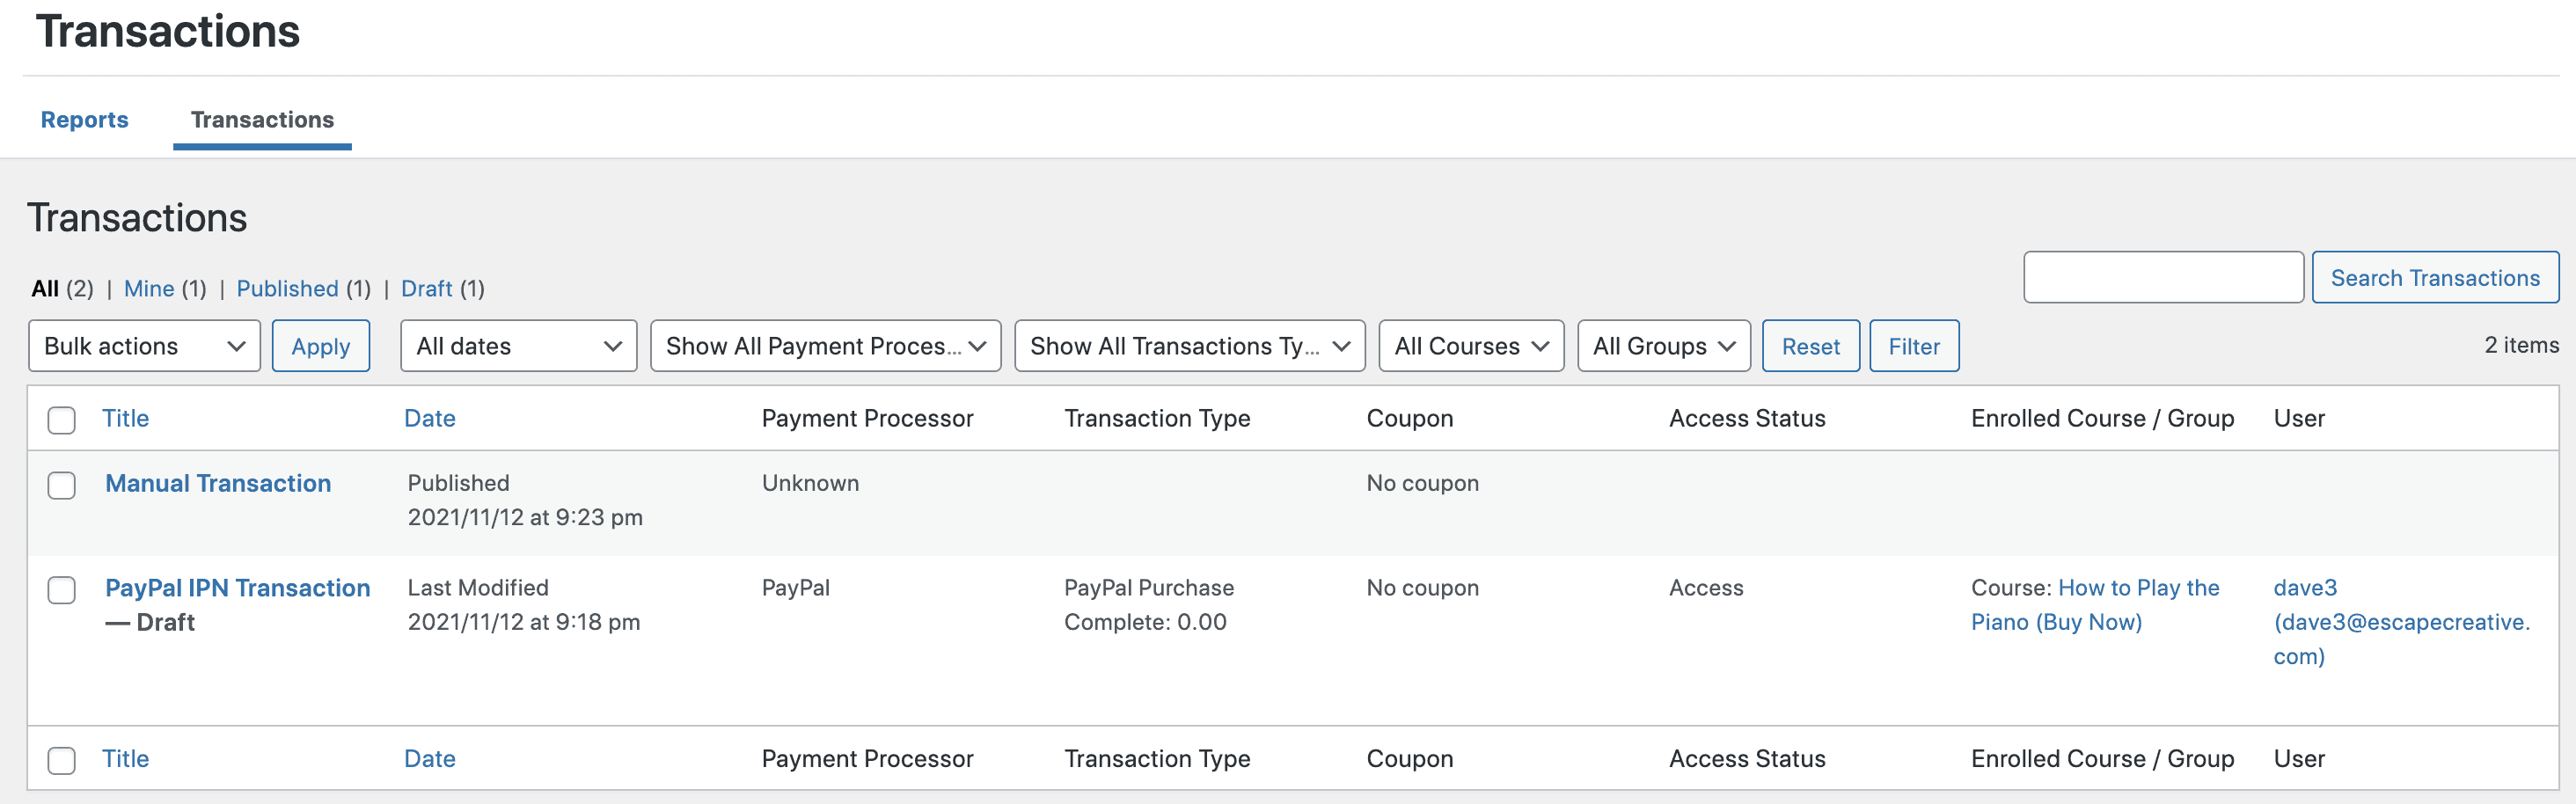
The following information will be shown for each transaction:
- Title
- Date
- Payment Processor (Stripe, PayPal, Razorpay)
- Transaction Type (pending, complete, canceled, expired, etc.)
- Coupon
- Access Status
- Enrolled Course/Group
- User
You use the dropdown menus at the top of the list to filter transactions by:
- date (month)
- payment processor
- transaction type
- course
- group
You can also search transactions by keyword, which is great if you’re looking for a specific user or email address. Use the search box in the top-right corner.
3. ProPanel
ProPanel is LearnDash’s own reporting plugin. It is a separate plugin that needs to be installed & activated just like any other WordPress plugin. Once activated, it displays 5 reporting widgets on your Dashboard in the WordPress admin area.
- ProPanel is included if you purchase a subscription to LearnDash Cloud
- Legacy customers of the LearnDash plugin (PLUS & PRO) plans also have access to ProPanel
- With LearnDash’s new pricing, it appears that ProPanel is no longer included, and is a separate $49/yr. add-on
Full Review: Read our full LearnDash ProPanel review →
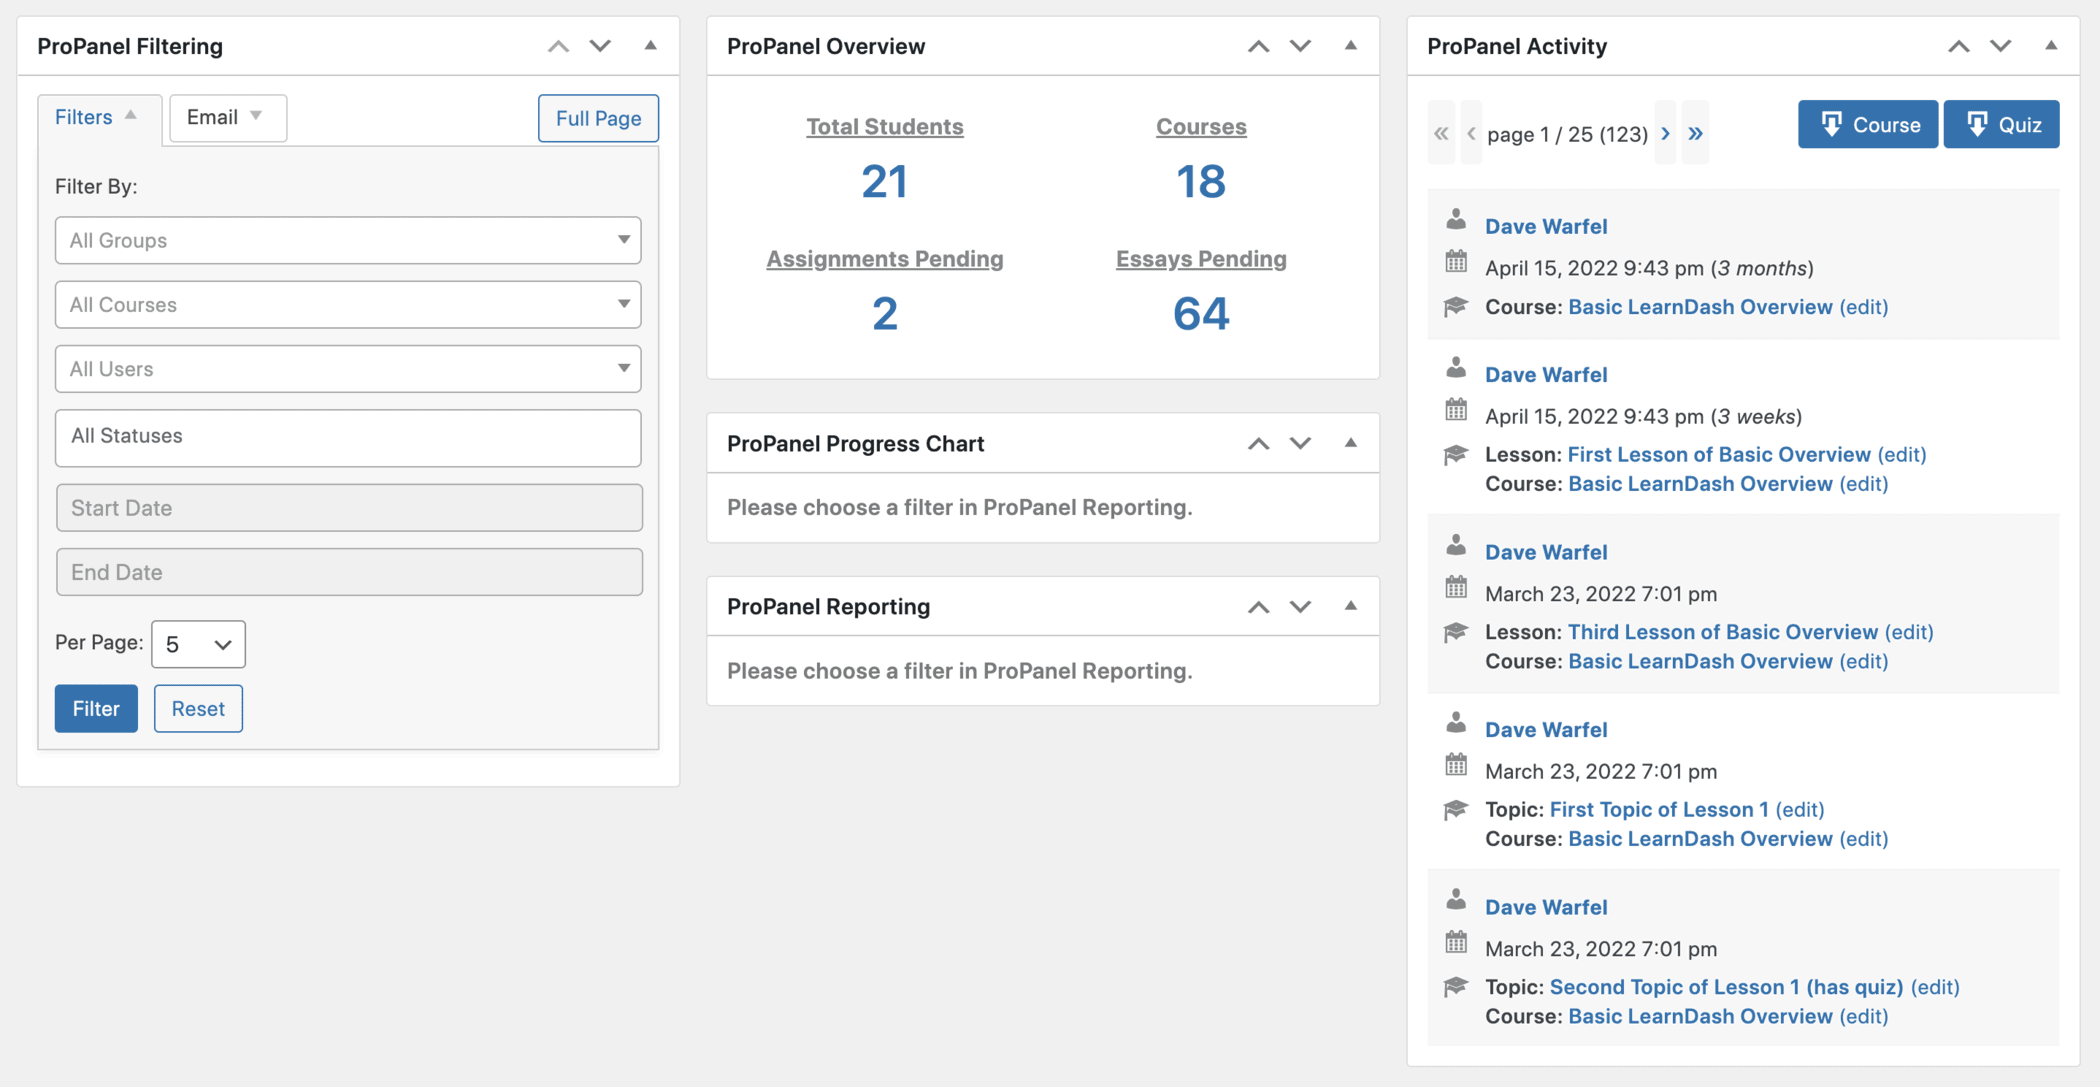
ProPanel Reporting Widgets
There are 5 total ProPanel reporting widgets, all displayed on the WordPress Dashboard screen. You can also display these widgets on the frontend of your site using the [ld_propanel] shortcode with various parameters. The 5 reporting widgets are:
- ProPanel Filtering
- ProPanel Overview
- ProPanel Activity
- ProPanel Reporting
- ProPanel Progress Chart
By default, ProPanel reports are only visible in the admin area to Administrators & Group Leaders.
- Editors, Authors, and Contributors will not see ProPanel reports.
- Administrators will see all data
- Group Leaders will only see data relating to the groups that they manage
To learn more, check out our free sample lesson on ProPanel.
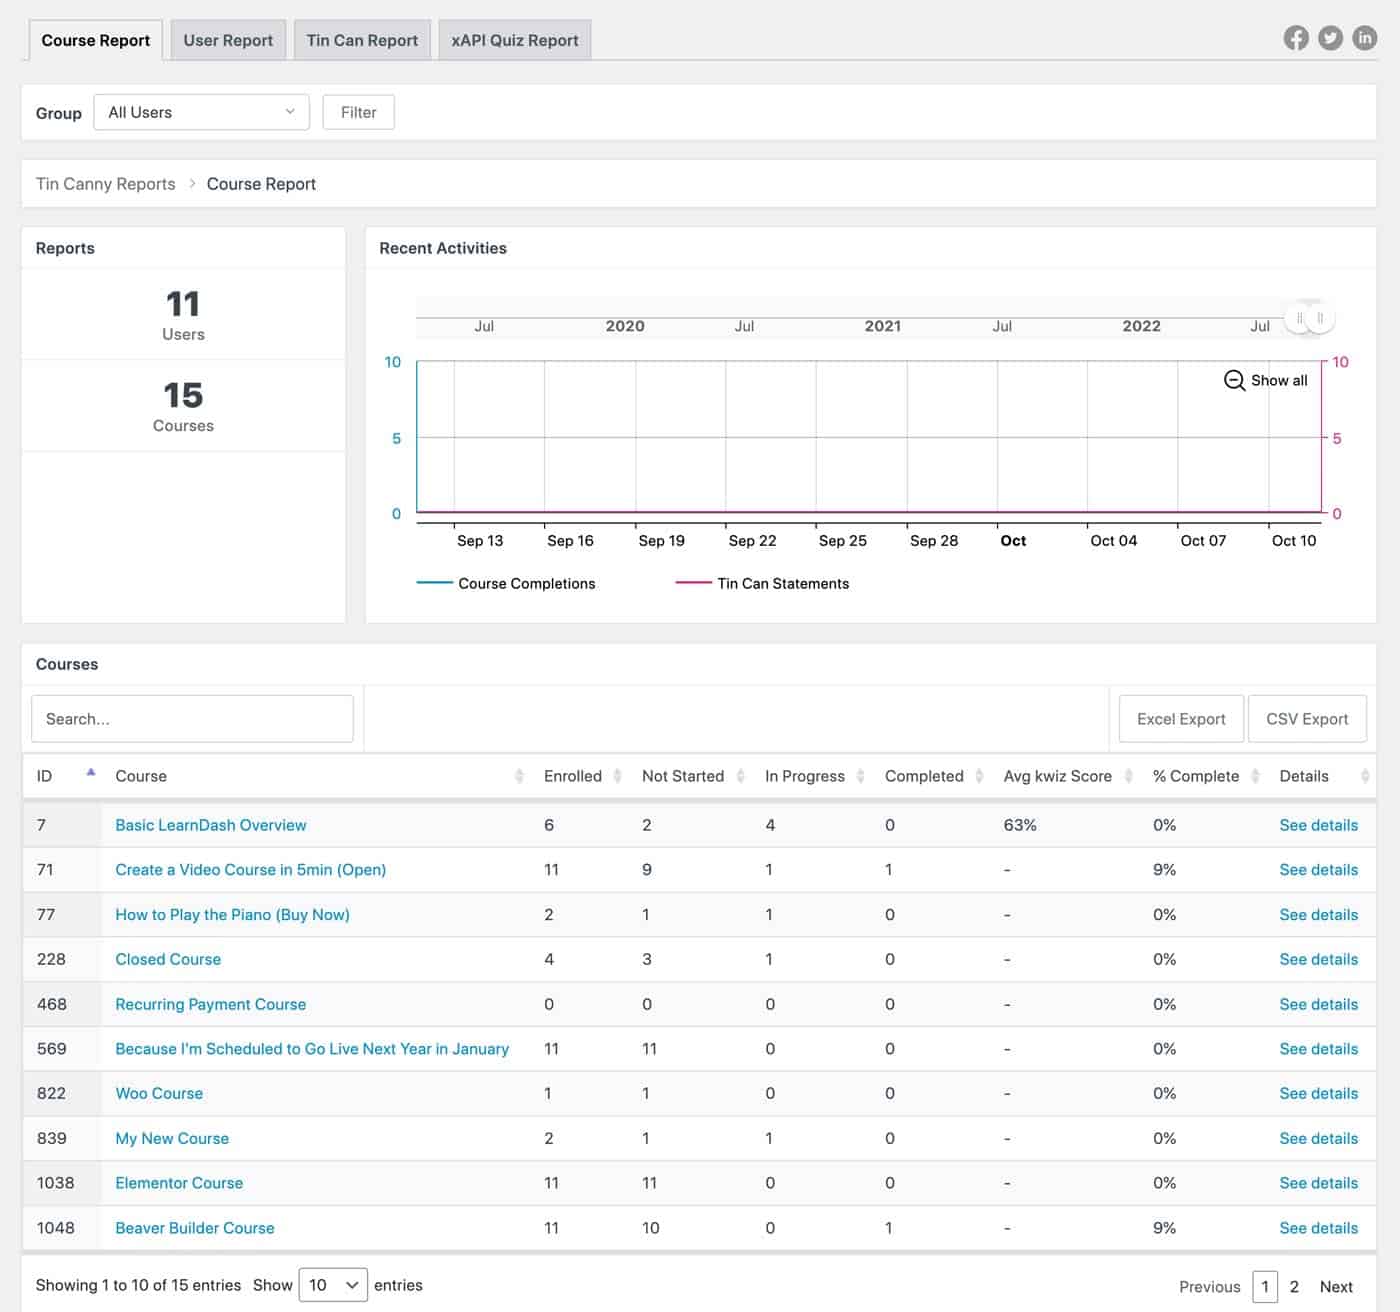
4. Tin Canny Reporting
Tin Canny Reporting for LearnDash provides an easy, convenient way to upload, track, and report on all types of SCORM and xAPI/Tin Can data, as well as standard LearnDash records. While its initial purpose may have been to provide reporting on SCORM and xAPI data, it’s still a valuable LearnDash reporting tool for those who are not using SCORM or xAPI, and just rely on typical LearnDash reporting metrics for courses, lessons, topics, and quizzes.
In general, Tin Canny Reporting provides 4 different types of reports:
- Course Report
- User Report
- Tin Can Report
- xAPI Quiz Report
The Tin Can & xAPI Quiz reports will only apply if you’re using Tin Can or xAPI data/authoring tools.
Types of Reports
Here’s an example of the basic course report. You can drill down to individual courses for even more granular data about each student of each course.
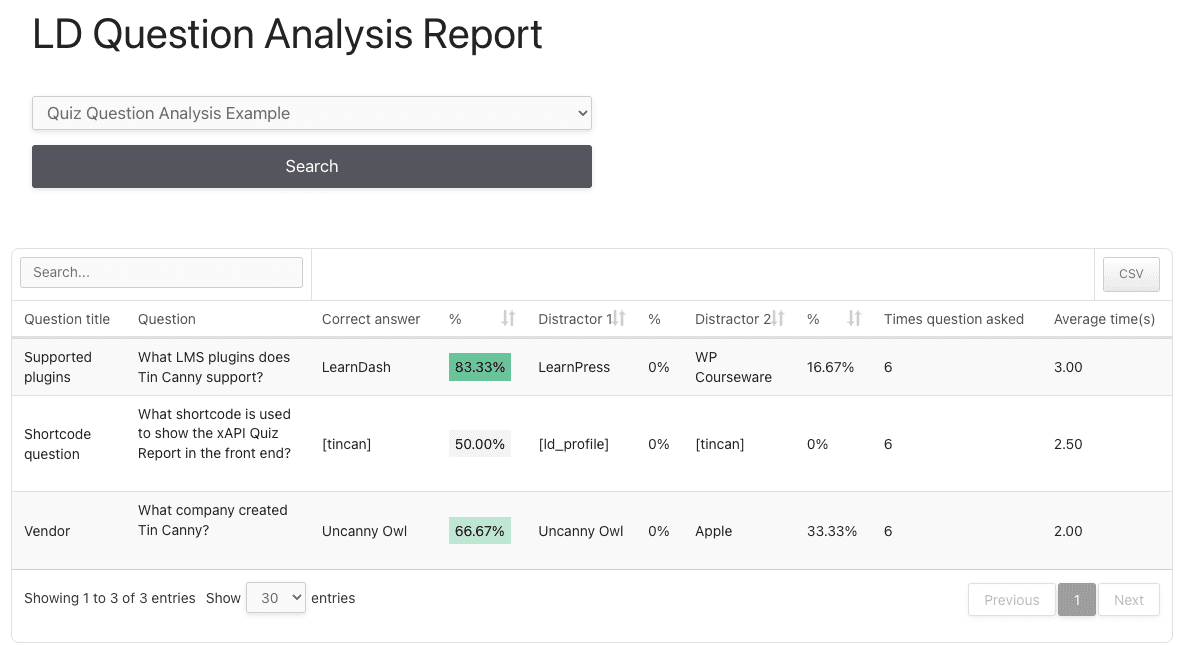
Tin Canny Reporting now also offers a Quiz Question Analysis Report. See below for an example.
5. WISDM Reports for LearnDash
WISDM Reports for LearnDash is a free plugin (with a premium upgrade) that provides additional reporting for LearnDash sites. It was created by WisdmLabs, a company known for creating products and offering services related to LearnDash.
Upon activating the plugin, a new page is automatically created for you on your Pages > All Pages screen. It should be called “Reporting Dashboard” or “LearnDash Reports.” This page contains a collection of blocks that display all of the free reporting options that the plugin offers.
Reporting Blocks
WISDM Reports makes use of the WordPress block editor. All of its reporting metrics are available individually, as blocks you can add to a reporting page. There are 14 total blocks available, some of which include:
- date filter
- total courses
- total learners
- total revenue *
- revenue from courses *
- daily enrollment
- time spent on course
- course completion rate
* Revenue data is only available for the default LearnDash payment methods (Stripe, PayPal, Razorpay). Third-party ecommerce data is not reported.
Permissions
By default, the following user roles will be able to view the reporting blocks on the frontend of your site:
- Administrator
- Group Leader
Premium Features
Upgrade to the premium version to be able to…
- download a few reports in
.csvand/or.xlsxformat - access quiz reports
- view percentage-based completion rates
- view # of pending assignments
- use advanced filtering
- track time in course
- …and more
6. Easy Dash for LearnDash
Most of the features in the Easy Dash for LearnDash plugin are in the free version, but you can export reports to .csv & .pdf with the pro version.
There are 3 types of data that Easy Dash for LearnDash displays:
- General stats in number format
- Bar + line graphs
- Tables
Easy Dash Number Stats
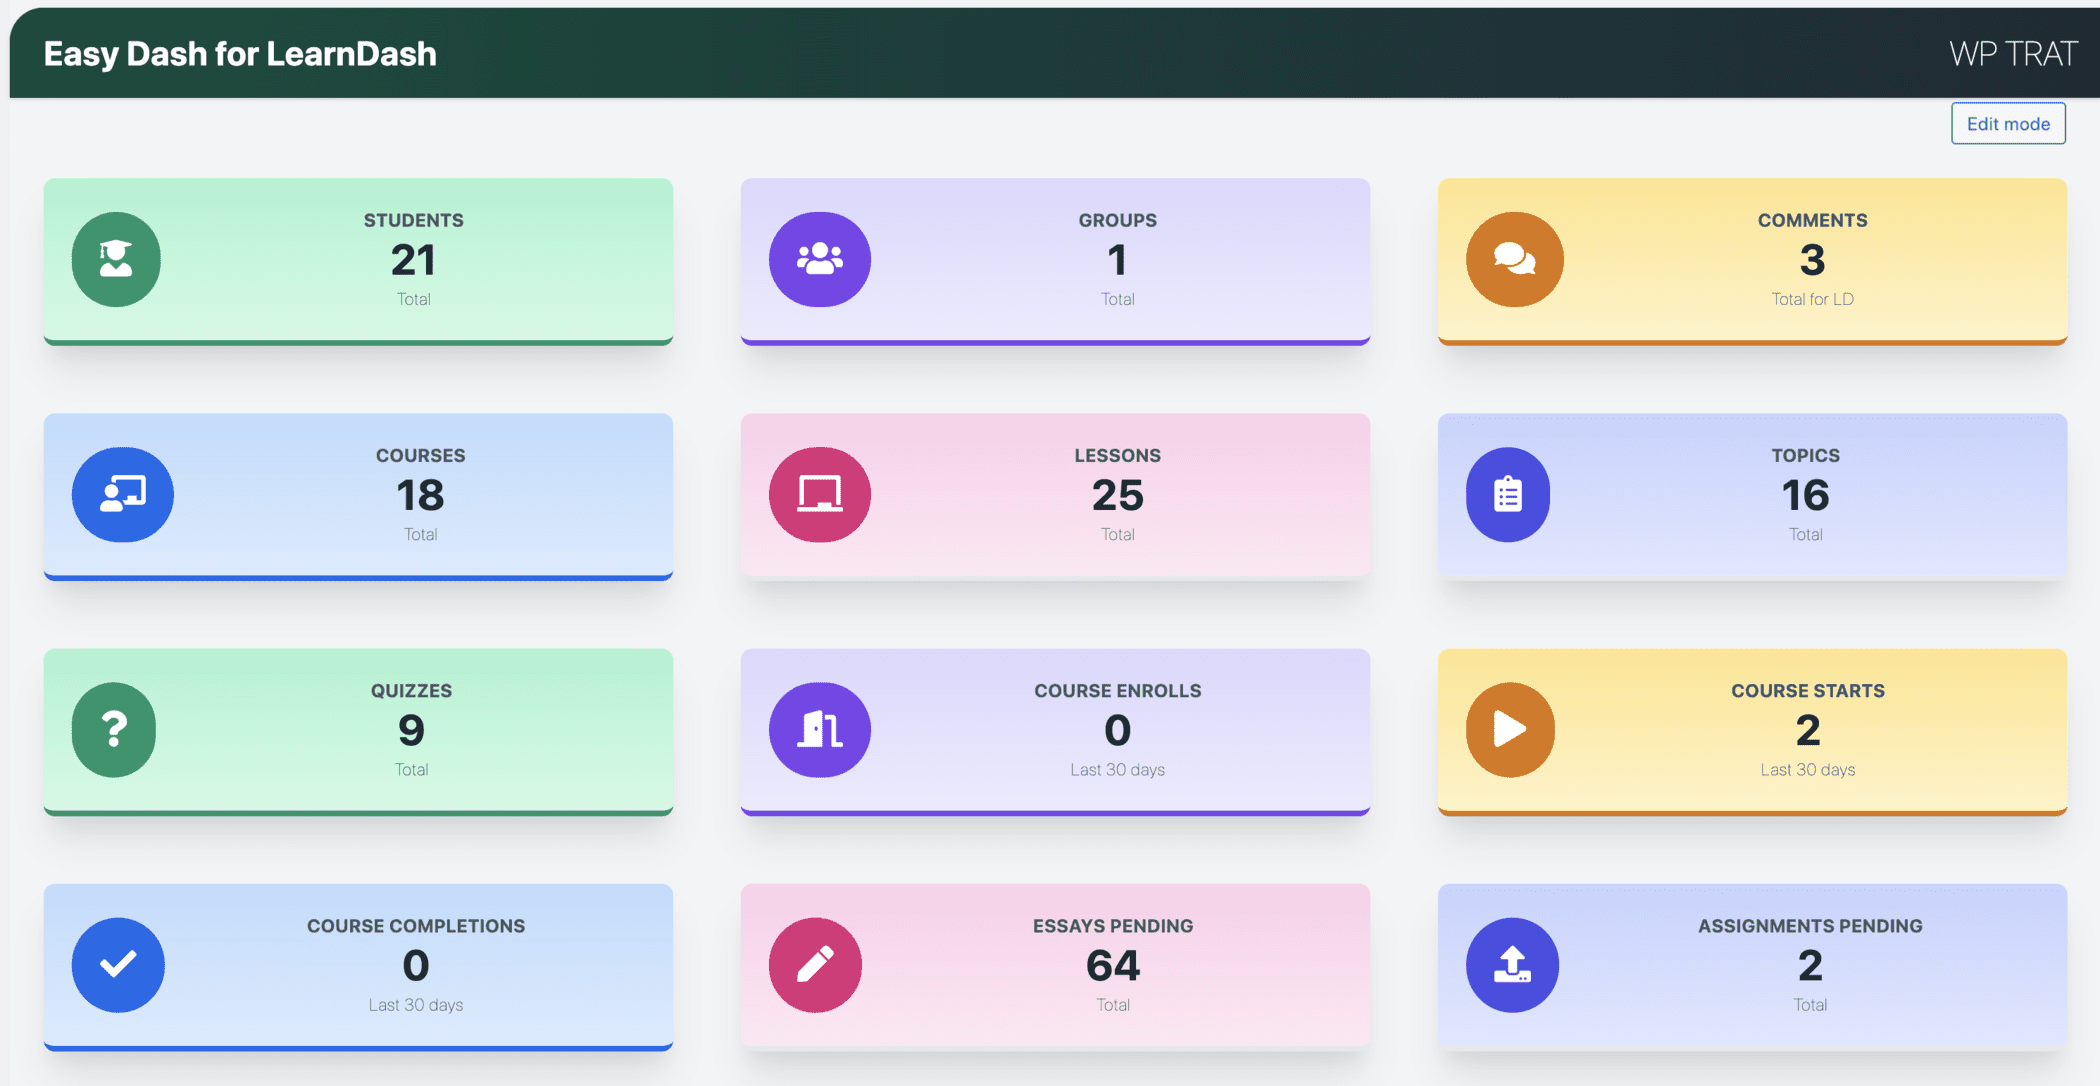
The following stats are available as numbers:
- Total students
- Total groups
- Total courses
- Total lessons
- Total topics
- Total quizzes
- Total comments (on LearnDash content)
- Total essays pending
- Total assignments pending
The following stats are available, with a custom timeframe attached to them. It shows “last 30 days” by default, but you can change this to 7, 10, 14, 30, 60, 90, 120, 180, 365, or all time.
- Course enrolls
- Course starts
- Course completions
For more about the charts & completion data that Easy Dash for LearnDash provides, I encourage you to install the free plugin and take a look around.
Report Customization
You can show/hide any of the stats you’d like. There’s a small X next to each stat that allows you to hide it if it’s not important to you.
Filtering
You can filter most of the stats to a specific course. Only one course can be chosen at a time.
Frontend Reporting
The pro version provides an [easydash] shortcode that allows you to display LearnDash reports on the frontend of your website.
7. Users Insights
The Users Insights plugin has a LearnDash integration that lets you list, search, and filter your LearnDash user activity. Users Insights detects the user activity, such as courses completed or a number of quizzes passed, and makes it available in the user table and filters. This allows you to search, segment, and analyze your user list based on LearnDash activity.
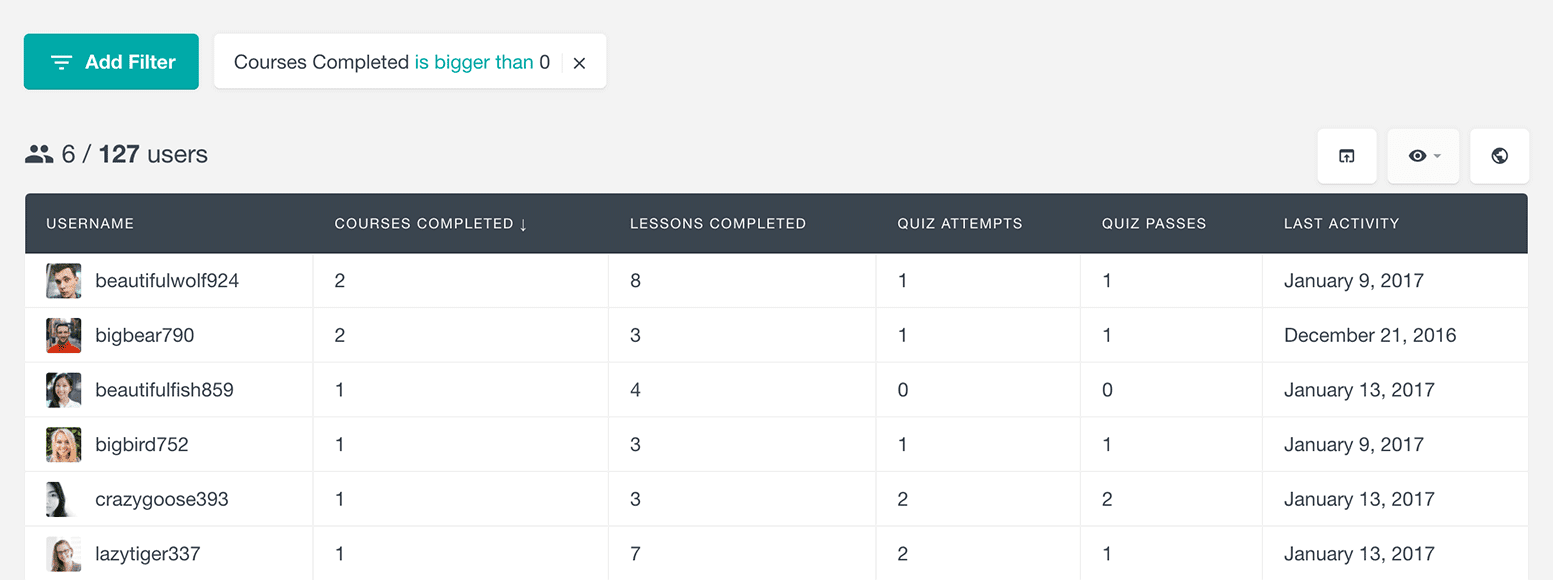
One of the cool things about this plugin is that it creates custom user profile screens for your users. Details about the course activity are available for each student in his/her Users Insights custom user profile section.

LearnDash activity reports can further be filtered by groups, last LearnDash activity, and more. Some quiz reporting is also included.
You can also combine LearnDash data with WooCommerce Memberships & Subscription data, and filter based on active/cancelled subscriptions.
We haven’t gotten our hands on a copy of the plugin yet, so to learn more, visit UsersInsights.com.
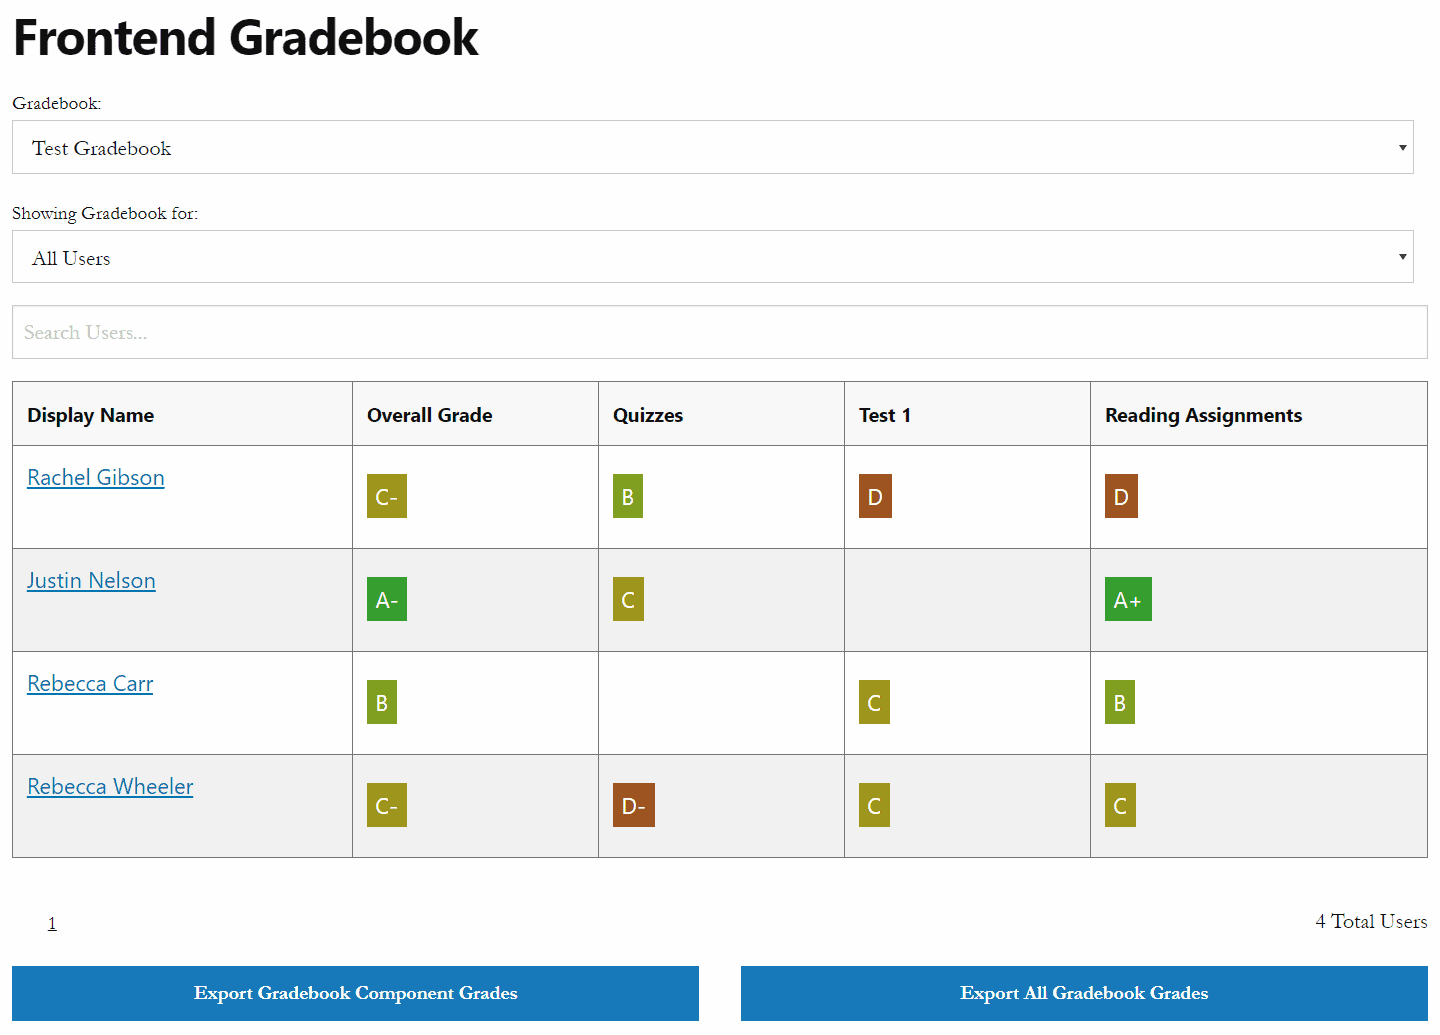
8. LearnDash Gradebook
LearnDash Gradebook provides a useful gradebook for teachers and group leaders providing a quick overview of all users’ grades. You can sort the gradebook by first & last name, email, and grade. Teachers and group leaders can search through users for information on grade averages, export grades to .csv, and view each user’s individual grades.
If you’re looking for additional LearnDash quiz reporting, this is by far the most useful plugin out there. It focuses specifically on quizzes, and leaves course reporting to some of the other options above. But it’s quiz & grading features are the best of any plugin on this page.
Features
- view gradebook on frontend (as well as backend)
- teachers & groups leaders can access gradebook
- display grades to students, showing grades & percentage scores
- utilize blocks and/or shortcodes to display grades & report cards on the frontend
- export grades to
.csv - choose which roles can view the gradebook
- set percentage values for A+, A-, A, B+, etc.
- manually change users grades
- view grades per LearnDash group
Buy LearnDash Gradebook for $49 →
9. SCORM / xAPI
Content created within LearnDash (lessons, topics, quizzes) is not SCORM compliant. You’ll need to use a third-party authoring tool for SCORM/xAPI content.
To track and report on SCORM and/or xAPI data, we recommend using the Tin Canny Reporting plugin.
There is another plugin that offers SCORM/xAPI reporting called the GrassBlade xAPI Companion. We have not used it and don’t know much about it, so we can’t recommend it, but you can do your own research.
10. Other LearnDash Reporting Plugins
- Quiz Reports Pro by WooNinjas
LearnDash Quiz Reports Pro allows you to take your analytics to the next level and generate custom CSV tables that reflect your student’s performance on any quiz.
There is one other plugin called LearnDash Front End Scores & Reports by 24/7 Digital Classrooms. However, I have heard mix reviews about the company, and don’t know of anyone actually using it, so I’m not going to link it here. You can easily find it through a web search, and evaluate it on your own to see if it does what you need.
Subscribe to our YouTube channel for more LearnDash tutorials.
That is everything we know about LearnDash reporting. If you know of a plugin or tool that we missed, please let us know in the comments. And if you need any help deciding on a plugin for the LearnDash reports that you need, let me know and I’ll try to help.
Laura
Do any of these reporting plugins offer a feature that can email you Excel reports on on a regular basis?
Dave Warfel
Hi Laura – Unfortunately, no. None of these LearnDash reporting plugins send email reports.
Anneliese
Thanks for putting this round-up together!
In my LearnDash Course Data Report, I’m not seeing columns for Course Started On, Total Time Spent on Course, Last Step ID, Last Step Type, Last Step Title, and Last Login Date.
Are these columns no longer available in the csv export? Or do I need to change my configuration settings so this data will export?
Dave Warfel
Hi Anneliese,
Last time we tested this, all that information was part of the default report, and should be included in the .csv export file. If it’s not, I would reach out to LearnDash support and ask them if they’ve changed something with how this works.
Anneliese
Update: I asked LearnDash support about this. The columns listed below are added to LearnDash Course Data exports when the ProPanel add-on has been installed.
Course Started On (date only, no time)
Total Time Spent on Course (in this format: 15d 6h 27m 9s)
Last Step ID (the post ID of the last lesson/topic/quiz the user completed)
Last Step Type (could be lesson, topic, or quiz)
Last Step Title
Last Login Date (date only, no time)
Dave Warfel
Thanks for the update!
Kosta
Is it possible to connect one of these plugins with an additional plugin and create functionality to send reports to a specific email address based on a specific time period (say quarterly)?
Dave Warfel
Hi Kosta — I don’t believe any of these plugins have integrations with other reporting tools, APIs, or email capabilities. However, because they are all WordPress plugins, they are extendable. You could hire a WordPress developer (preferably someone who knows LearnDash well) to write some custom code that taps into the reports that these plugins provides, and uses the default WordPress email system to send emails quarterly.
If there was one tool that I could recommend, it would be Uncanny Automator. They have a ton of integrations with LearnDash, and they might have something that enables you to send automatic emails with ProPanel reports. You can always ask their sales team, too.
Kosta
Thanks for the quick response and suggestions. I will try to do something with your suggestion.
Dave Warfel
🙌🏼
Elias Musawi
Thank you for the great content.
Is there a plugin which offers better performance report for the students?
Something that creates a more sophisticated dashboard.
Dave Warfel
Hi Elias – It depends on what type of metrics you’re looking for. I don’t know exactly what you mean by a “performance report.”
If you’re looking for more student-focused quiz reporting, LearnDash Gradebook is the best bet.
If you want a more advanced “my profile” for students, where they can see a better overview of all of their course, lesson, topic, and quiz progress, the Uncanny Toolkit Pro’s Student Dashboard module is worth a look.
Jim
Great plugin summary! I’m looking for a plugin for my students. I have students with access to 100+ courses, and they want to know which ones they have completed, which ones are in progress, etc. Any suggestions? From my research, it looks like LD reporting focuses on management.
Dave Warfel
Thanks Jim!
You are correct in that most of LearnDash’s reporting options focus on the admin way more than they do the student. The one exception is LearnDash’s Gradebook plugin, but that is almost exclusively for quizzes, and doesn’t provide the student with COURSE reporting.
1. The default LearnDash Profile block/shortcode does display this information, but the design leaves a lot to be desired. It will display badges for “in progress” and “completed,” but there’s no way to filter it to only show completed courses or only show “in progress” courses.
2. A similar but improved premium option is the Course Dashboard module in the Uncanny Toolkit Pro. It’s a fantastic plugin with many other helpful modules (if you need them).
3. You’ll need to check with their support team to see if this is supported, but GridbuilderWP might have a filter/facet for the LearnDash Course Grid that enables the user to filter by completion status. This would give them the option to view all “in progress” courses, for example, in one place.
Those are the main ways I can think of right now to better improve the user’s course viewing experience.
Let me know if you decide to go with any of them, or if you have any other questions.
Alex
Hello Dave,
very interesting article with great tips for a better overall experience. I’m looking for a plugin that would enable to create a great “My account” page for my students. I already have Easy Dash (and plan to buy Uncanny Toolkit Pro for statistics for my team) but I look for something to upgrade reporting options for our students as well.
I’d like to have on “My account” information from Surecart, Gamipress (achievements, points and so on) and Learndash course statistics for our students. The more reporting for students, the better.
There are no instructors on our page, our team is the only party creating courses. I heard quite a bit about WBCom Designs that created impressive dashboard for admins, instructors and students but as this company is from India, I have a bit trust issues to buy their plugin. Have you heard anything about this company or their plugin? Would you trust them with your business?
Best wishes,
Dave Warfel
Hi Alex,
I know a little about them but haven’t used their products extensively so I can’t give you an objective answer on the quality of their plugins.
The sense I get is that their design and UI looks good, but the functionality and customization might be lacking. As for their support, I’ve heard mixed reviews.
Sorry I couldn’t be of more help.
Myron Kirby
Dave,
Thanks for the recap. We want to convert from LearnDash. Do you know any tool that we can use to export or print all of our courses, lessons, and quizzes.
Student information and history is not needed.
Dave Warfel
Hi Myron,
I don’t know of anything off the top of my head, but it really depends on what platform/plugin you are planning to convert to.
If you’re staying within the WordPress ecosystem, you could look at a plugin like Post Type Switcher. This would allow you to change all your LearnDash Courses, Lessons, Topics, and Quizzes into the new post type for whatever your new LMS plugin uses.
You could also look into WordPress exporting tools. There’s popular plugin called WP All Export, and a companion plugin called WP All Import.
If you plan to move off WordPress, I think your best bet will be to copy the content from each lesson, and try pasting it into the new platform’s content editor. If you have mostly test-based content (paragraphs, headings, lists), this should work pretty well. If you have more complex layouts, or built your content with a site builder like Elementor, this isn’t going to work so well.
Best of luck!